- Use LINEST instead of copying an equation off of a best-fit curve on a chart
- Remember, it's an array function!
Deprecated: Array and string offset access syntax with curly braces is deprecated in /home/thexsect/public_html/wp-content/plugins/easy-table/inc/Encoding.php on line 156
Deprecated: Array and string offset access syntax with curly braces is deprecated in /home/thexsect/public_html/wp-content/plugins/easy-table/inc/Encoding.php on line 158
Deprecated: Array and string offset access syntax with curly braces is deprecated in /home/thexsect/public_html/wp-content/plugins/easy-table/inc/Encoding.php on line 159
Deprecated: Array and string offset access syntax with curly braces is deprecated in /home/thexsect/public_html/wp-content/plugins/easy-table/inc/Encoding.php on line 160
The LINEST function has been useful to me more times than I can count. And yet, I don’t see it used often by others (I think the reason is because it’s an array formula). I’ll explain what an array formula is, but this post is also intended to be my personal quick reference for the LINEST syntax. As often as I use LINEST, I still need to look up it up every time!
LINEST Quick Reference
| Function | Expression | Equation | Returns | |||
|---|---|---|---|---|---|---|
| Exponential base b | y=abx | =LINEST(LN(y) |
x) | LN(a) and LN(b) | ||
| Exponential base e | y=aex | =LINEST(LN(y) |
x) | LN(a) and b | ||
| Linear | y=mx+b | =LINEST(y |
x) | m and b | ||
| Logarithmic | y=aLn(x)+b | =LINEST(y |
LN(x)) | a and b | ||
| Polynomial | y=m*xi+n*xi-1+…+ b | =LINEST(y |
x^{… | n | m}) | m n and b |
| Power | y=axb | =LINEST(LN(y) |
LN(x)) | LN(a) and b |
| Data Orientation | Polynomial Order Formula | |||||
|---|---|---|---|---|---|---|
| Columns | =LINEST([known_y's] |
[known_x's]^{1 | 2 | 3} | [const] | [stats]) |
| Rows | =LINEST([known_y's] |
[known_x's]^{1;2;3} | [const] | [stats]) |
LINEST Example
I’m going to use a few baseball numbers for the sake of an example. Specifically, plate appearances (PA) and runs scored (R). I’d like to produce and estimation of the number of runs a player would score given their number of plate appearances. I’d also like to know if this linear equation is generally good at prediction runs or not. Don’t worry if you’re unfamiliar with baseball, we’re really just using them as arbitrary numbers.
Keep in mind, I’m using static data in this example. The true power of the LINEST function lies in using dynamic input data. I’ve watched far too many people produce a graph, select a trendline, display the trendline’s coefficients, then copy/past those values elsewhere for use in another formula. If just one piece of input data changes, the entire process is repeated. Why go to all this extra work when the LINEST function automatically does it for you!?
Using LINEST
The first step is to select a 5×4 range of cells so that the array formula can return values for every cell in the array. If you don’t select all 20 cells, the function will only calculate values for the selected portion of the array. Next, type in the equation and instead of pressing enter, hit CTRL+SHIFT+ENTER. This is required to establish it an array formula.
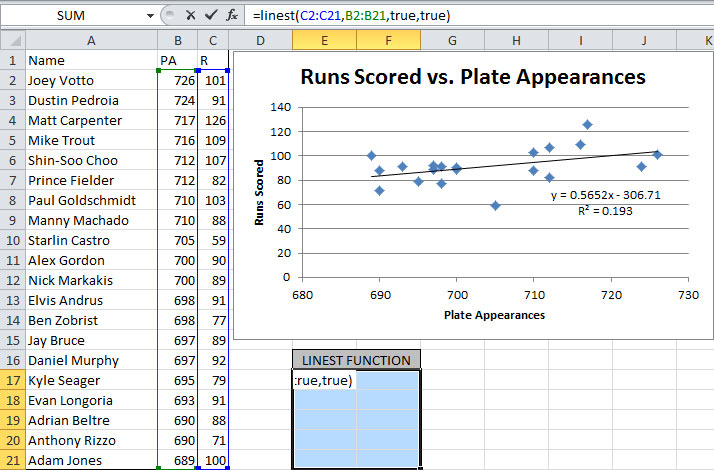
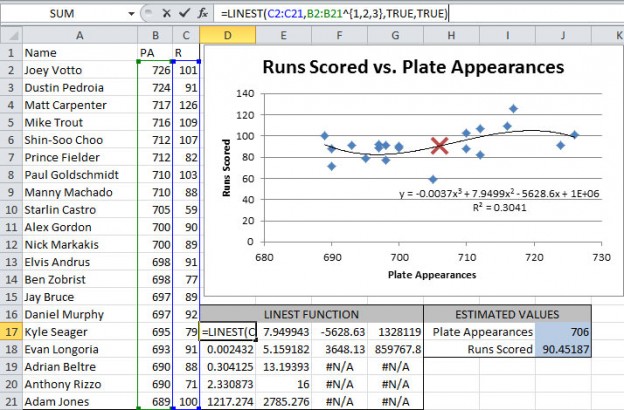
I can now create another formula in the form of mx + b by referring to the numbers the LINEST function created for me! You can see this in action below, with my linearly extrapolated value depicted on the chart as a red X. Notice that the coefficients shown next to the trendline match the values in the top row of the LINEST function. The coefficient of determination (R2) is located in the first column, third row. The other values in the array formula include advanced statistical information you wouldn’t have access to by just using the trendline approach!

While that example covers linear data, polynomials include additional syntax. The polynomial’s order is specified by adding a vector on the [known_x’s] argument. Also, be sure to select the appropriate number of cells for the array formula, corresponding to the number of coefficients needed. Since data can be oriented both vertically, or horizontally, there’s a small provision in the formula for whether your data are in columns or rows. Refer to the Quick Reference above. Notice the exponent on to the [known_x’s] is either a , or a ; depending on the orientation of data.

SYNTAX Explanation
The basic syntax is LINEST([known_y's],[known_x's],[const],[stats]). The first two arguments are straightforward, but the next two offer several options.
- [const] – Refers to how b is calculated in the linear y = mx + b equation
- TRUE: The b is calculated normally
- FALSE: The intercept, b, is set to 0 so that the equation passes through the origin
- [stats] – Specifies whether or not additional regression statistics are displayed
- TRUE: The additional stats are included in the array formula
- FALSE: The additional stats are not included in the array formula
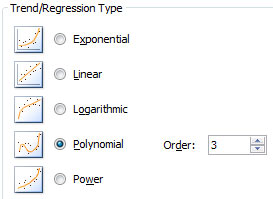
With that in mind, Excel offers several different ways to calculate trendlines on a graph, as shown below. All those can be handled by LINEST as well! Refer to the quick reference above for how to generate coefficients for different trend/regression types.
In conclusion, I hope you’ve found this reference useful. For more reading on the LINEST function, refer to these links for additional details.
http://people.stfx.ca/bliengme/ExcelTips/Polynomial.htm
http://office.microsoft.com/en-us/excel-help/linest-HP005209155.aspx